BI infrastructure deployment is not a trivial undertaking. A well-established BI infrastructure offers high return on investment and a competitive advantage.
Publish Latency
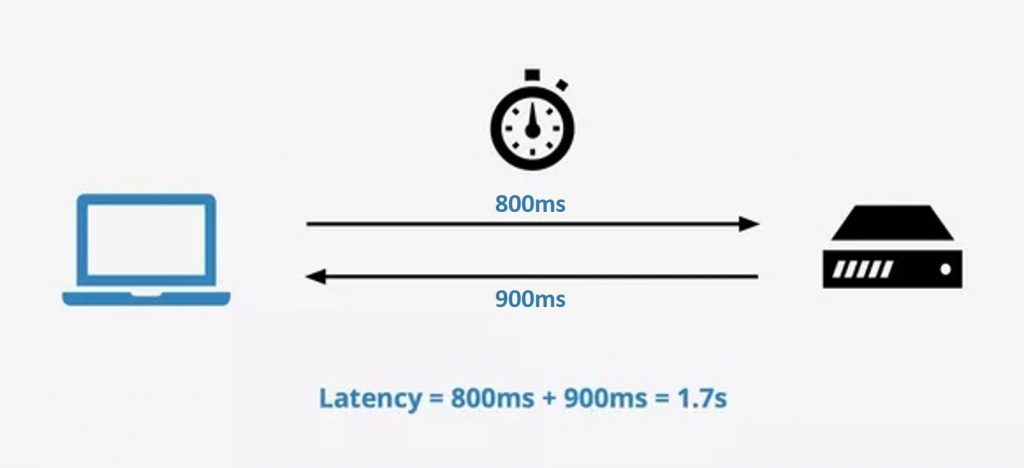
The method of data processing and loading of the data model both take time and is conducted on a periodic basis. It is known as BI environment latency that the time it takes for the data to travel from the source systems to the data model through this schedule. Make sure the BI infrastructure is built to fulfill business users’ latency requirements.
Upon creation of latency requirements, make sure the consumers are aware of them. Maybe you also want to set up a mechanism that allows users to know the time of the last load.
Training and Support
Power BI is easy to use. I strongly believe however that every tool needs preparation for users to acclimatize the tool and how it wishes to handle the data. The training offers a systematic way, if nothing else, to encourage users to dig in and manipulate the details for themselves.
Off the shelf or real-life?
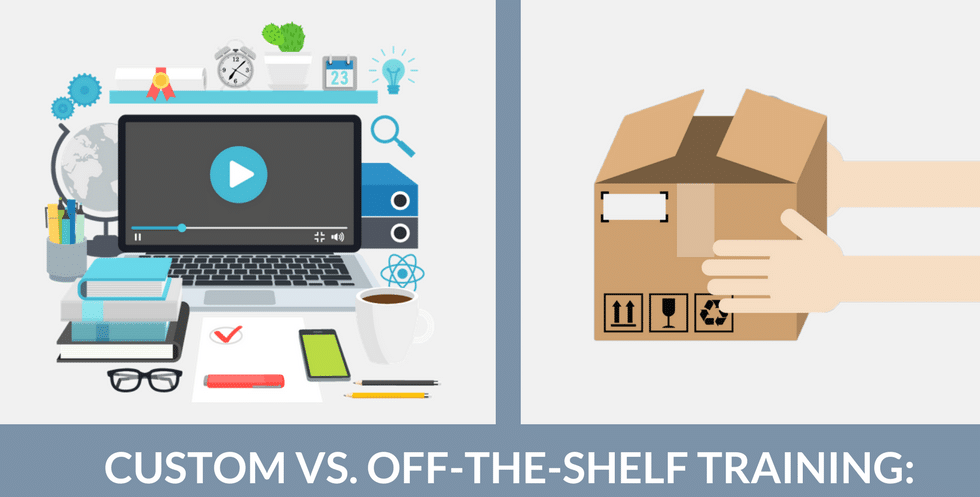
The training should not, if possible, be an off-shelf training with sample material. The use of their own data would help consumers even more. The instruction should help consumers understand about their own operations and areas of responsibility for the first time.
Live interaction

Following the initial preparation, new ways to help market users can be developed. Which could entail promoting membership in a forum or local user group targeted at company users of the tool. Users should be offered a platform to ask questions, share milestones and improve awareness.
Right Tool for the Job
Power BI can’t do everything
In a variety of cases, I have seen companies join a self-service analytics initiative assuming that the self-service tool can satisfy their monitoring needs. This is not going to be the case in nearly all cases. Power BI is a very strong weapon, but it can’t do everything, nor should it be expected to do it.
Attempting to produce content of a certain type using a process that is less than optimal for that purpose leads to disgruntled consumers.
What is the optimal approach?
The optimal approach is to look at all the reporting and analysis needs of the enterprise and then choose the right methodology and the appropriate author for each. A few of the needs can be met by visualizations generated in a more structured reporting environment, such as SQL Server Reporting Services by IT department.
Switch from Self-Service analytic to IT-maintained content
Other needs can be addressed by visualizations generated in Power BI by the IT department due to their extensive usage and the need for tighter management. It may be the case that the visualization originally created by a company user becomes so commonly used that it needs to switch from self-service content to IT-maintained content.
Standards and Limits
Free to choose any tool … ?
Using the best tool for the job also ensures that the company can have more than one product in the chest of its visualization tool. However, this does not mean that any company customer should be able to pick whichever visualization method they need.
Optimize productivity
A collection of standard tools for the different visualization needs of the enterprise should be developed, and then market users should be expected to function under that set of standards. This helps the company to optimize its knowledge and productivity using this collection of resources.
Varied user choices!
Company customers are expected to come from other organizations with prejudices against the visualization methods used in those settings. The organization’s visualization tool options should be reviewed annually to ensure that they are all modern and well maintained.
Influences
Any of these influences—a consumer deciding to incorporate a new tool or to re-evaluate the tool collection—may produce a motivation to modify the set of tools. This has to happen periodically in order to achieve optimum outcomes from the visualization environment, but can only be achieved through due thought. Once developed, changing the traditional visualization tools is time consuming and disruptive.
Successfully using Power BI
Now that we’ve set standards for your BI project success, it’s time to start looking at Power BI itself. But you have to have a solid understanding of the way Power BI operates before pursuing the development of Power BI visualizations. The layout of a BI infrastructure designed around Power BI will be further explored in next posts.
No Comments Yet